At AlterNET Software, we’ve been dedicated to developing a range of scripting and debugging engines that empower users to write and execute code in various programming languages within .NET applications.
The primary aim of these engines is to equip .NET developers with tools that enable their application users to write custom scripts. This empowers users to extend the application’s functionality, much like how Visual Basic for Applications (VBA) allows users to automate tasks in Microsoft Word or Excel.
I’d like to highlight the scripting engines we’ve developed, along with their respective advantages and disadvantages:
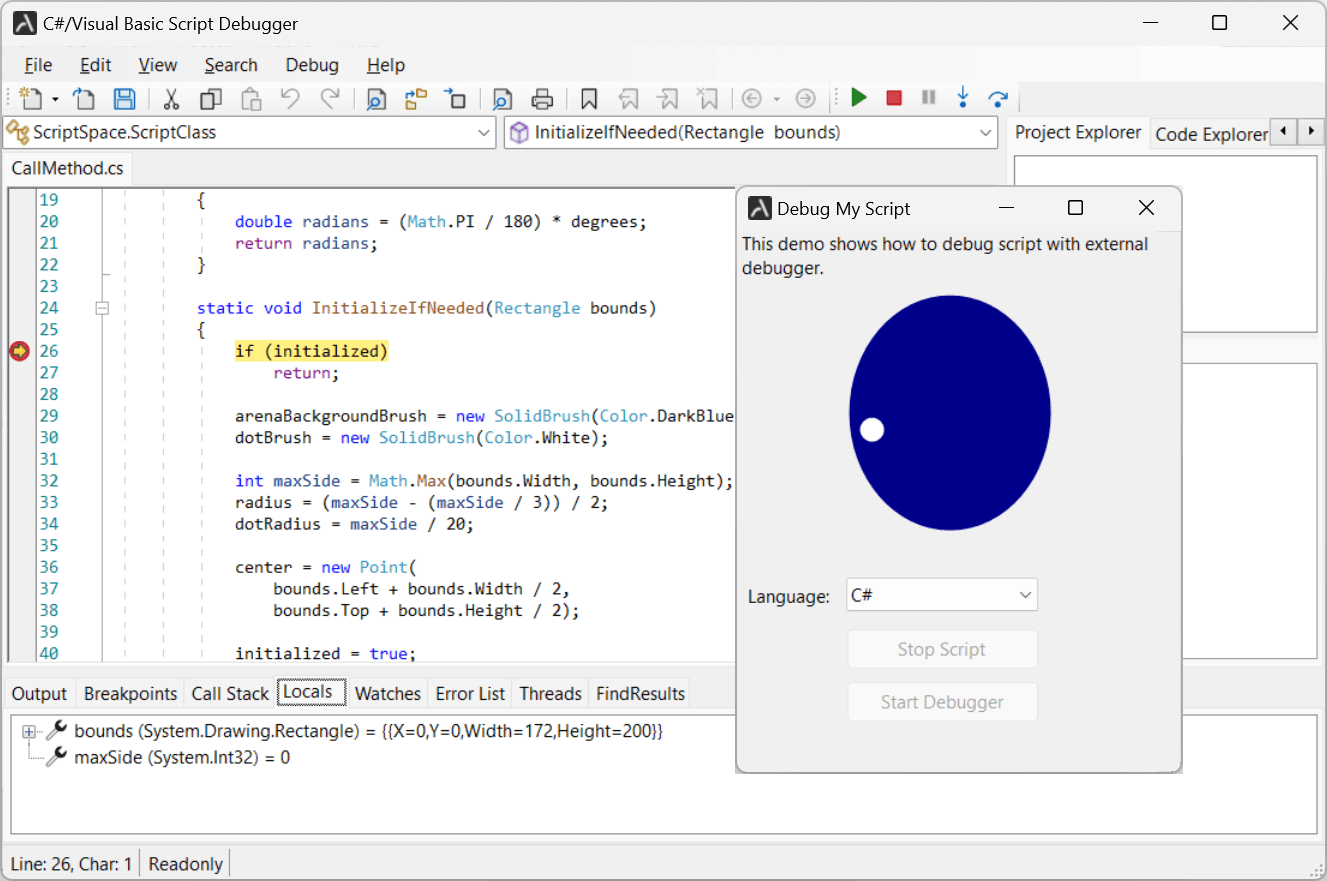
C# and Visual Basic scripting and debugging
Our initial scripting engine allows you to seamlessly integrate C# or Visual Basic scripting capabilities into your .NET applications. This empowers your users to write custom scripts and execute them within your application’s context.
Evolution of scripting technology
Initially, we implemented scripting for C# and Visual Basic using the CodeDOM technology. However, we later transitioned to the modern Microsoft Code Analysis APIs (Roslyn) for enhanced performance and features. These APIs are also utilized in our Code Editor, providing a coding experience akin to Visual Studio’s text editor.
Read our blog to read more about syntax parsing that powers C# and Visual Basic code editing.
A robust script debugger
The AlterNET script debugger for C# and Visual Basic is built on the NET Framework Command-Line Debugger (mdbg), which leverages ICorDebug interfaces. These interfaces are integral to the .NET Framework and are used internally by the Visual Studio debugger. Our debugger offers essential debugging features like step-by-step execution, breakpoints, expression evaluation, and more.
Addressing limitations
Due to the nature of compiled scripts being converted into machine instructions, there are inherent limitations when running and debugging scripts within the same application process. To overcome this, we offer two approaches:
-
Separate Script Debugging Application: The script debugging logic can be implemented in a standalone application. This separate application can then be attached to the primary application process to debug .NET scripts executed within the main application.
-
Separate Script Executable: The script itself can be compiled into a separate executable. This approach may require inter-process communication techniques to enable the script to access application-defined objects.
Refer to our other blog to read more about these limitations.

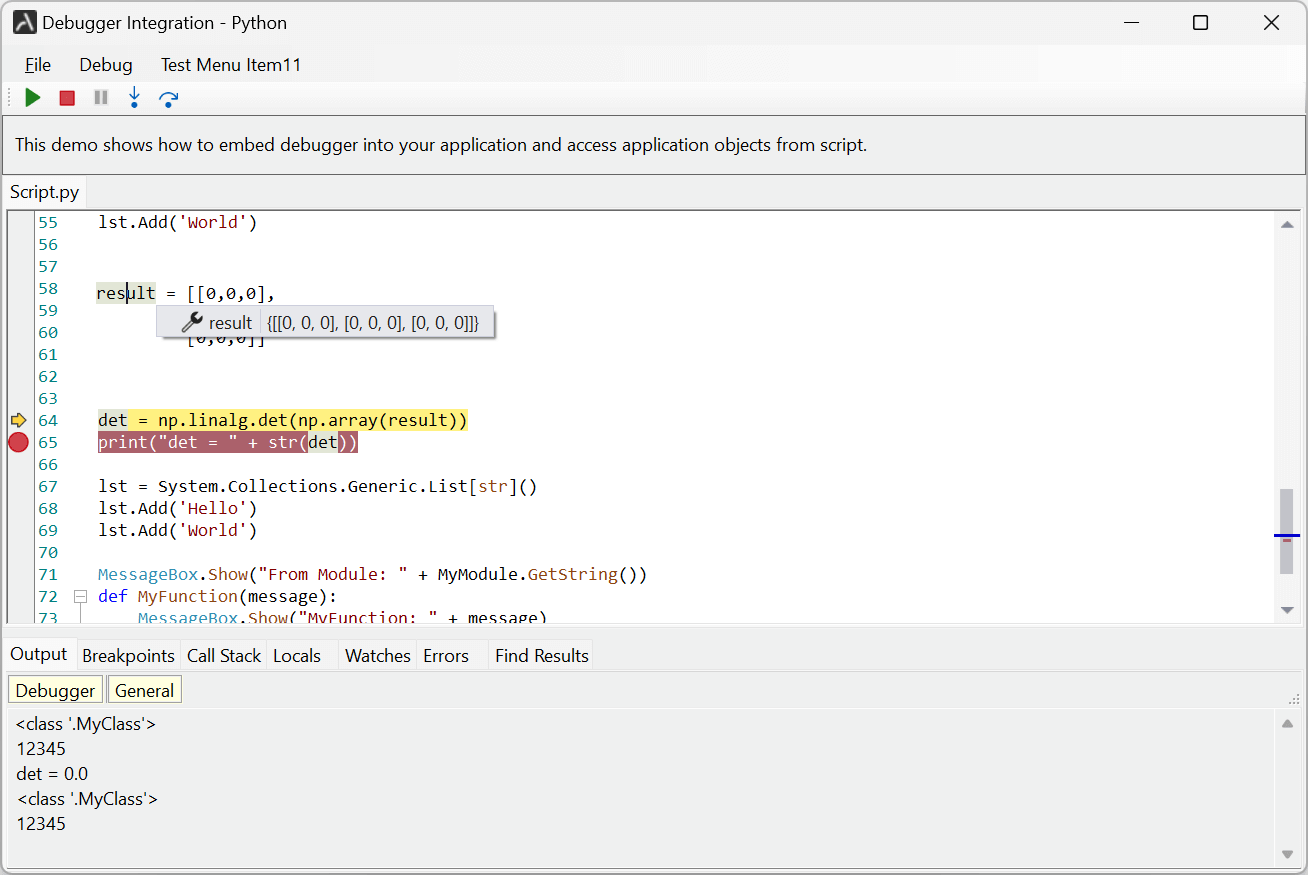
Python and IronPython scripting and debugging
As discussed in detail in this blog, we offer two separate scripting engines for Python integration within your .NET applications:
-
IronPython: This Microsoft implementation of Python allows seamless script execution and debugging within the same application process. You won’t encounter limitations related to native code execution, making it a convenient choice. However, accessing application objects (such as getting properties of visual controls) needs to be done in a thread-safe way for Python/IronPython scripts in debug mode, as these scripts are executed in a separate thread while debugging.
-
Python.NET: This package provides near-seamless integration for Python programmers with the .NET Framework. Benefits include access to numerous third-party libraries like Pandas and NumPy, which offer modules written in C/C++. However, this approach requires Python or embedded Python to be installed on the target computer and lacks multithreading capabilities.
Python and IronPython debugging features
Python and IronPython script debuggers offer a feature set nearly identical to the C#/Visual Basic debugger. Unlike the C#/VB.NET debuggers, which may have limitations due to the compilation of native code, Python and IronPython scripts can seamlessly integrate and debug within the same application process. This provides a more straightforward and efficient debugging experience for developers working with these scripting languages.
Proprietary Python parser for code editing
Regarding script code writing, neither of these engines natively includes code editing APIs. To address this, we’ve developed our proprietary parser specifically for Python/IronPython. This parser offers a range of advanced code editing features, including code completion and code outlining. These features enhance the overall scripting experience, making it easier for users to write and maintain Python/IronPython code within your application.

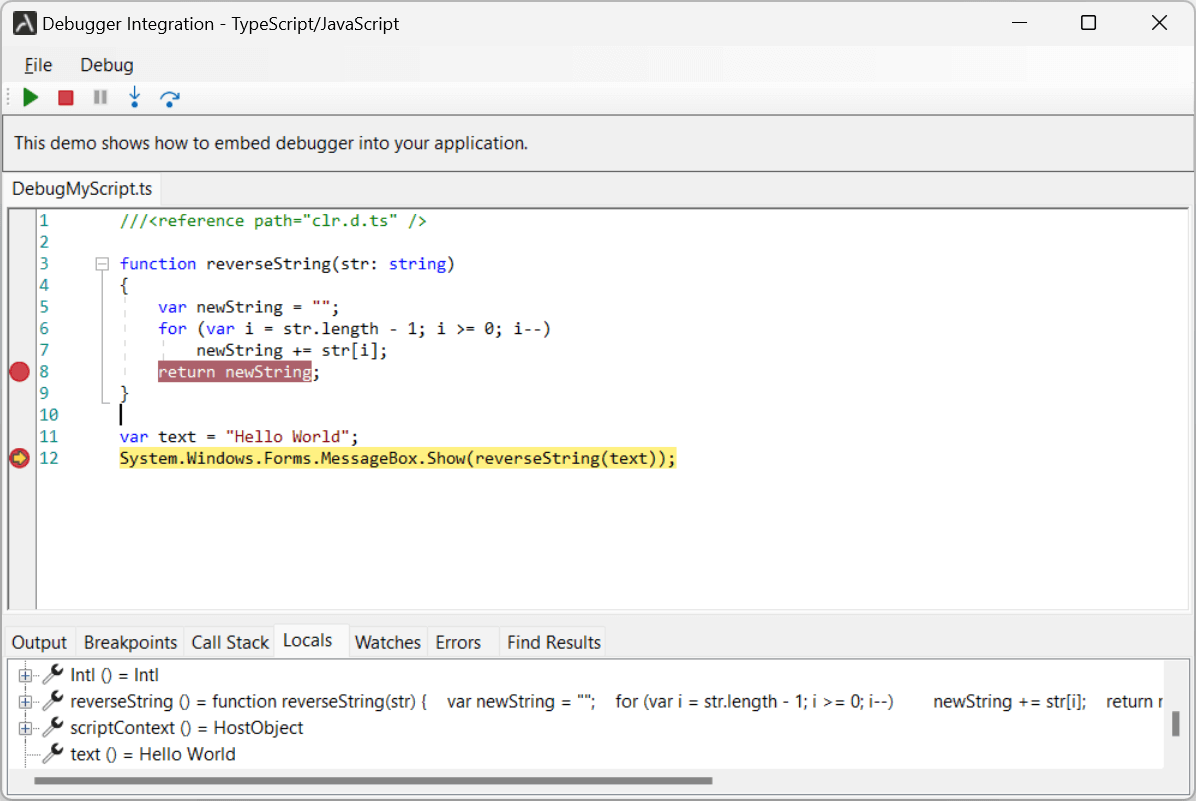
TypeScript and JavaScript scripting and debugging
As highlighted in our blog, we’ve integrated TypeScript/JavaScript scripting using Microsoft ClearScript. For debugging, we leverage the Google Chrome Debugger development tools.
Behind the scenes: TypeScript compilation
Running TypeScript code for the first time involves several steps, including generating type definition files for referenced .NET assemblies and converting TypeScript to pure JavaScript code. This initial compilation process may take some time.
TypeScript/JavaScript debugging features
The TypeScript/JavaScript debugger offers a comprehensive set of debugging capabilities, comparable to C# and Python debuggers. However, it currently lacks multithreading support.
Leveraging Microsoft TypeScript for code editing
Beyond scripting, Microsoft TypeScript provides robust APIs for code editing. We’ve fully utilized these APIs in our TypeScript parser, delivering a coding experience similar to editing TypeScript code within the Visual Studio Code text editor.

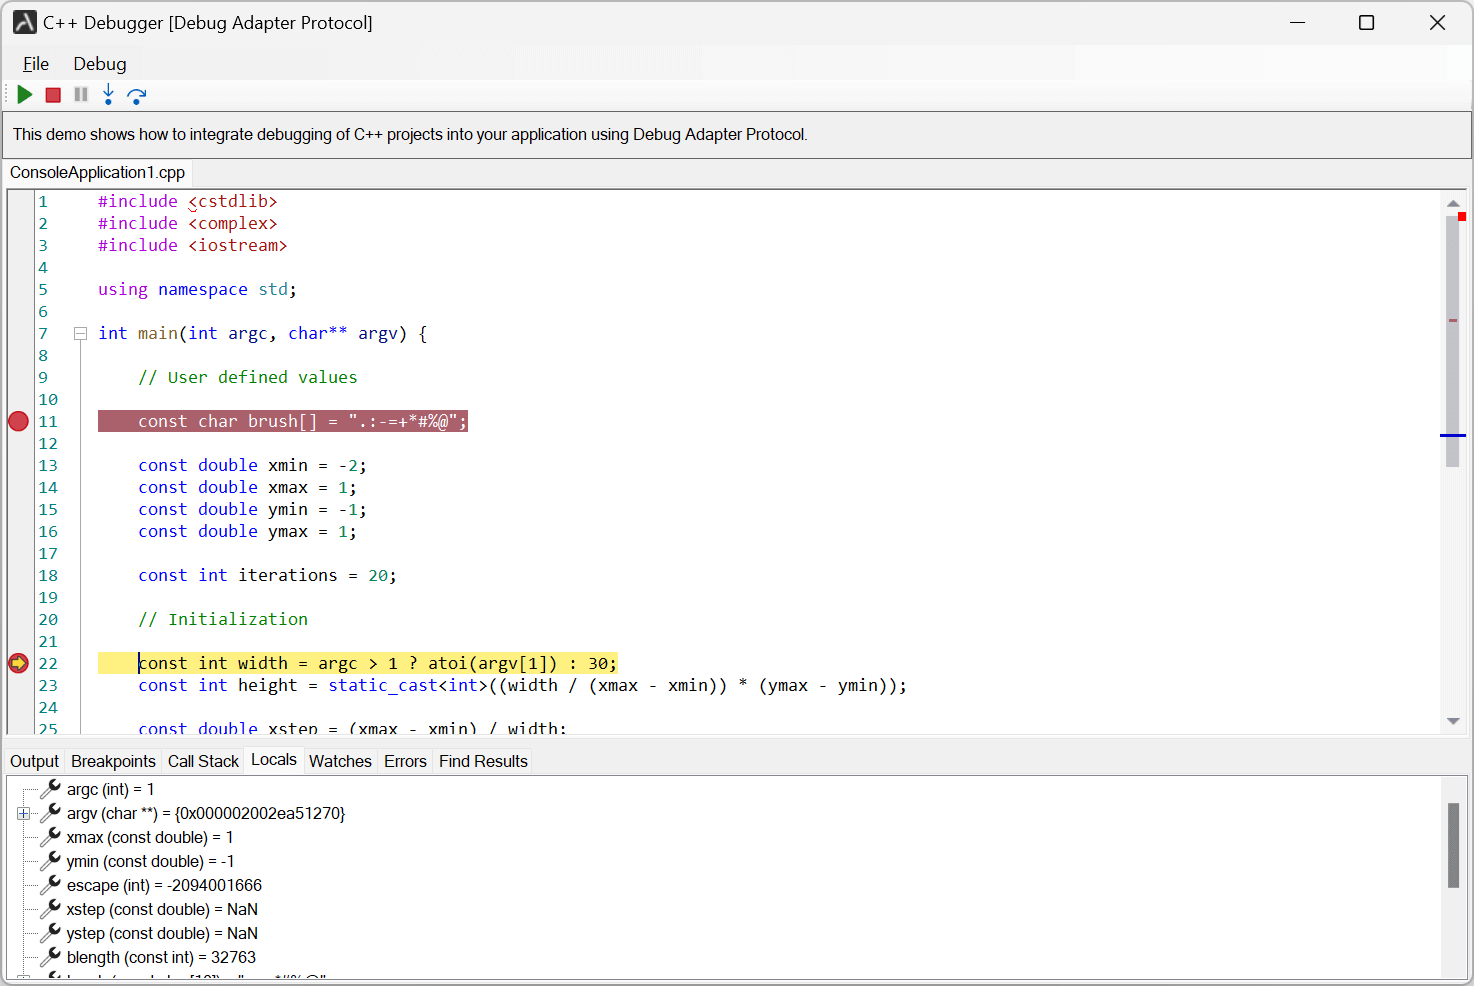
Script debugging using DAP (Debug Adapter Protocol)
As detailed in our blog, we’ve utilized the Debug Adapter Protocol (DAP) to implement a generic debugger within our development tool. DAP enables seamless communication between the debugger and various programming languages via Debug Adapters. These native tools, implementing DAP, must be installed on the target computer.
External tool dependency
Unlike our other scripting engines, this one relies on external tools for script debugging. It’s not designed for in-application script execution or debugging. Instead, it’s intended for developers creating integrated development environments (IDEs) similar to Microsoft Visual Studio, Eclipse, and others.
Code editing with Language Server Protocol
For code editing features like auto-complete, go to definition, and finding references, we’ve integrated our Language Server Protocol (LSP) parsers with the DAP script debugging engines. This provides a comprehensive coding experience within your IDE.
Read our blog to read more about our LSP syntax parsers.
Initial implementations
While writing this blog, we successfully implemented debugging for C++ and Python using this approach. We plan to extend our Debug Adapter Protocol (DAP) engines to support additional languages, such as PowerShell. This would broaden the range of scripting languages that can be debugged within our development environment.

